ARIA Education
As anti-amyloid therapies for Alzheimer’s disease (AD) move from research into routine care, Amyloid-Related Imaging Abnormalities (ARIA) have emerged as a common adverse event. Many clinicians and radiologists today have not yet seen enough cases to confidently spot these subtle changes on Magnetic Resonance Imaging (MRI). Without focused training, ARIA can be missed or misinterpreted, putting patients at risk of complications.
This initiative fills that gap by providing:
- Clear, step-by-step guidance on understanding ARIA and recognizing patterns on MRI
- Interactive learning with real-world case studies to build your confidence in ARIA assessment and management
- Recommended literature for radiologists, neurologists, and trainees
This website has been developed through unrestricted grants from our sponsors, who had no involvement in its development or content.
What is ARIA?
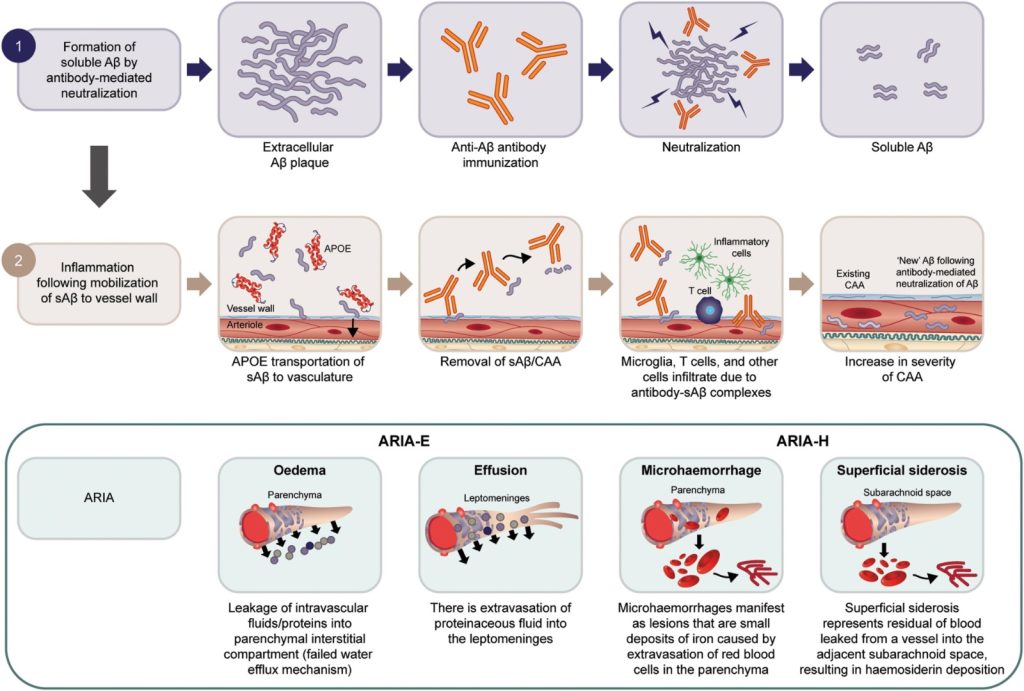
Several amyloid‑β–targeting monoclonal antibodies have received regulatory approval for AD treatment. By clearing amyloid plaques, these agents can normalize amyloid positron emission tomography (PET) scans after several treatment sessions. An important adverse event is ARIA. These MRI‑detectable changes are thought to result from transient increases in blood–brain barrier permeability following rapid plaque removal. ARIA presents in two forms—ARIA‑E (edema/effusion) and ARIA‑H (hemosiderin)—which can occur independently or concurrently.


Hampel et al, Brain, 2023.
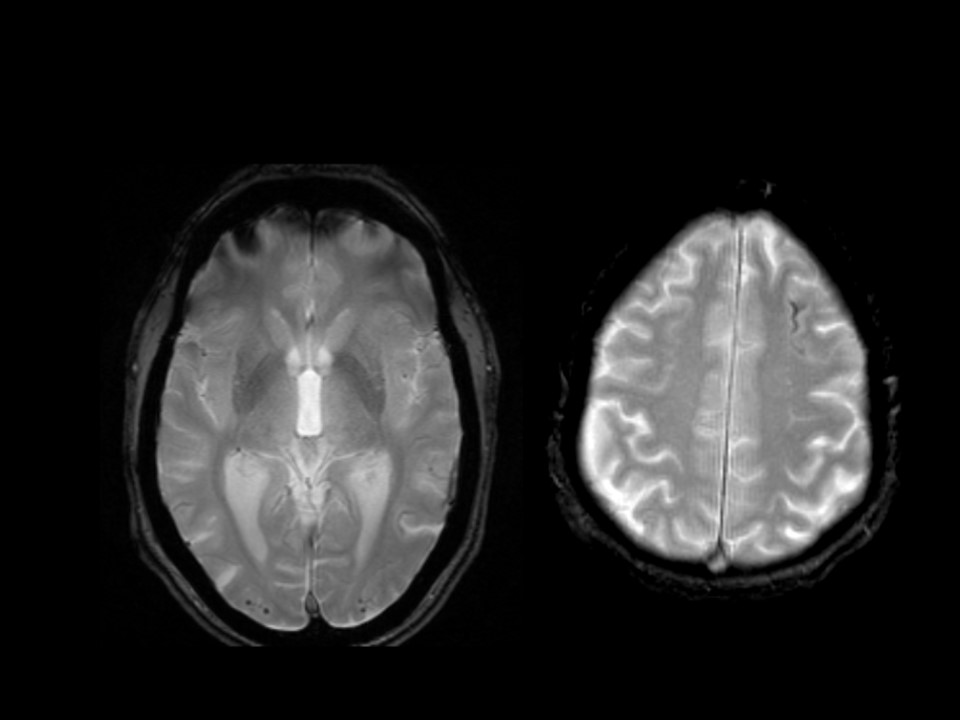
ARIA-E is caused by increased extravasation of protein-rich fluid resulting in vasogenic edema and/or effusion. MRI changes are best detected as bright signal on T2-fluid-attenuated-inversion recovery (T2-FLAIR) sequences.


ARIA-H is characterized by small deposits of blood containing hemosiderin, which can either be parenchymal (microhemorrhages) or superficial siderosis in the pial or subarachnoid space. These changes can be detected as dark signal on susceptibility-sensitive sequences, such as T2* gradient echo (GRE) or susceptibility-weighted imaging (SWI).

MRI – sequence
Appearance
Parenchymal
Sulcal
ARIA-E
T2-FLAIR
bright
edema
effusion
ARIA-H
T2* GRE or SWI
dark
microbleed
siderosis
Incidence and Risk Factors
ARIA occurs in 10–40% of patients treated with anti‑amyloid therapies, with rates varying by antibody and individual genetic risk profile. New ARIA‑H commonly co‑occurs with ARIA‑E. Each individual case should be assessed for risk factors, which could require more frequent MRI monitoring.
- Genetics: Apolipoprotein E4 (APOE ε4) genotype is one of the strongest predictors, with homozygous individuals carriers at highest risk
- Dose dependence: The risk of ARIA‑E increases with higher antibody doses
- Amyloid burden: Greater baseline amyloid‑β pathology appears to predispose to ARIA‑E
- Antithrombotic use: Some studies showed that antithrombotic medications are a significant risk factor for ARIA-H.
- CAA markers on MRI: Features of cerebral amyloid angiopathy (CAA)—such as microhemorrhages, cortical siderosis, enlarged perivascular spaces, and white‑matter hyperintensities—also predict ARIA. In clinical trials, patients with superficial siderosis or five or more microhemorrhages were excluded
- CAA itself is caused by amyloid‑β accumulation in cerebral vessels and/or leptomeninges (the two innermost layers of the brain’s protective membranes), and may occur in AD or independently
- CAA‑related inflammation (CAA‑ri) can lead to spontaneous, steroid‑responsive ARIA in patients with extensive vessel amyloid pathology.
Considerations for patients with existing cerebrovascular disease
Appropriate Use Recommendations exclusion criteria for several anti-amyloid therapies are as follows:
- > 2 lacunar infarcts or stroke involving a major vascular territory
- Severe white matter hyperintensities (Fazekas grade 3)
- Any intracerebral hemorrhage (ICH) > 1 cm in diameter
- > 4 microhemorrhages
- Any focus of cortical superficial siderosis
EMA and FDA labels advise that caution should be exercised in all cases of pre-existing cerebrovascular disease. Clinical trials excluded patients with pre-existing white matter disease, ischemic infarction, ICH > 1 cm in diameter, > 4 microhemorrhages, and cortical superficial siderosis on baseline MRI. In cases with a history of ischemic infarction and white matter disease, cognitive impairment had a substantial vascular etiology, limiting potential benefit from anti-amyloid therapy. Furthermore, patients with ischemic lesions were more likely to require antithrombotic treatment, increasing the risk of ICH.
Clinical Presentation
- ARIA most often emerges weeks to months after initiating anti‑amyloid therapy
- ARIA‑E typically resolves spontaneously—or after treatment interruption—within a few weeks to months
- ARIA‑H lesions tend to persist chronically
- Up to 25% of patients may experience recurrence of ARIA on later scans
- Symptoms:
- The majority of ARIA cases are asymptomatic
- When symptoms do occur, they are usually transient and non‑specific, such as headache, confusion, dizziness, nausea, or visual and gait disturbances
- Severe presentations are rare but can include focal neurological deficits, seizures, or encephalopathy, sometimes necessitating hospitalization
- Co‑occurrence:
- New ARIA-H findings typically occur alongside ARIA-E and in the same location, rather than in isolation
ARIA-E – resolution


ARIA detection
For detection, pre-treatment and on-treatment scans should be compared side-by-side, for example, using PACS viewing environments with automatic linking by slice position. It is recommended that reading is done by an experienced reader, preferably a (neuro)radiologist with expertise in reading ARIA safety scans. Standardized reporting and timely communication of ARIA findings are essential for adequate management of ARIA, which may involve treatment interruption or suspension.
Imaging protocols
The core sequences for ARIA detection are T2-FLAIR and GRE. 3T scanners are recommended, as they detect abnormalities with higher sensitivity, although 1.5T scanners are also acceptable. It is of note that classification of ARIA-H is based on 2D GRE data, as these sequences have primarily been used in ARIA clinical trials. Efforts should be made to follow each patient with the same acquisition protocol, scanner, and coil. Detailed acquisition protocols for each MRI vendor can be found here.
Imaging indications
- Baseline assessment:
- To identify any brain MRI findings that could contraindicate treatment or require more frequent monitoring
- To identify T2-FLAIR hyperintensities and microhemorrhages to serve as a reference for comparison with safety monitoring scans
- Asymptomatic ARIA monitoring:
- Depending on the anti-amyloid drug being prescribed, a schedule of monitoring scans linked to the scheme of infusions should be initiated
- This is particularly relevant in the first few months of treatment, since this is the period when the majority of ARIA cases occur
- Continuing treatment in an asymptomatic patient with ARIA depends on the level of severity
- Symptomatic patient under anti-amyloid treatment
Proposed protocol ARIA monitoring
| BASELINE | ASYMPTOMATIC | SYMPTOMATIC |
| 2D T2-FLAIR (or 3D)1 | 2D T2-FLAIR (or 3D)1 | 2D T2-FLAIR (or 3D)1 |
| T2* GRE | T2* GRE | T2* GRE |
| DWI | DWI | DWI |
| T2 Optional: SWI | Optional: SWI | + Additional sequences as needed |
BASELINE
———————-
2D T2-FLAIR (or 3D)1
T2* GRE
DWI
T2
Optional: SWI
ASYMPTOMATIC
———————-
2D T2-FLAIR (or 3D)1
T2* GRE
DWI
Optional: SWI
SYMPTOMATIC
———————-
2D T2-FLAIR (or 3D)1
T2* GRE
DWI
+ Additional
sequences as needed
1Even though 2D FLAIR was the sequence used during trials, 3D T2-FLAIR is preferred over 2D for superior spatial resolution and uniform cerebrospinal fluid (CSF) suppression
DWI = Diffusion-weighted imaging
Core imaging features
ARIA – E (Edema/Effusion)
- Imaging appearance:
- T2‑FLAIR: Hyperintense (bright) signals from interstitial edema and/or sulcal effusions
- Conventional T2‑weighted: Parenchymal edema visible, but sulcal effusions resemble CSF
- DWI/ADC: May show increased ADC signal (vasogenic edema) without restricted diffusion
- Morphology & distribution:
- Lesions are typically ill‑defined and can be monofocal or multifocal
- Most commonly affect posterior subcortical white matter (parietal/occipital), but may extend into deeper or posterior fossa structures
- Mass effect frequently present; severe cases can appear pan‑hemispheric with midline shift
- Technical considerations:
- Sulcal effusions are best detected on T2‑FLAIR—protein‑rich fluid remains hyperintense against suppressed CSF
- 3D T2‑FLAIR is preferred over 2D for superior spatial resolution and uniform CSF suppression
- In very mild cases, the only clue may be sulcal effacement (narrowed cortical sulci from partial CSF signal retention)


- Common interpretive errors and artifacts:
- ARIA‑E can be difficult to differentiate from pre‑existing white matter hyperintensities—common in normal aging and cerebrovascular disease—since both appear as parenchymal hyperintensities on T2‑FLAIR images.
- Care should be taken to avoid mislabeling bright CSF signals in the orbitofrontal region and around the brainstem, where CSF flow artifacts can be bright depending on vendor-specific implementations
ARIA‑H (Hemosiderin)
- Imaging appearance:
- Susceptibility‑sensitive sequences (T2* GRE or SWI) reveal new hypointense (dark) foci
- Microhemorrhages: Round lesions 3–10 mm in diameter, typically lobar (cortico‑subcortical) and often clustered when multiple
- Superficial siderosis: Linear or curvilinear hypointensities along the pial surface of one or more sulci, producing a “tram‑track” pattern
- Distribution:
- Microhemorrhages: Predominantly near the cortical ribbon, mimicking the pattern seen in CAA
- Siderosis: Usually confined to one sulcus but can be multifocal
- Common interpretative errors and artifacts:
- Flow voids: Take care not to mistake normal vessel flow‑voids for microhemorrhages—correlate with T2 or time‑of‑flight sequences
- Susceptibility artifact: Beware of dark areas near the skull base or from patient motion
- Venous structures: Subdural or subarachnoid veins track continuously to the dura and remain unchanged on serial scans; true ARIA‑H lesions are new and non‑anatomical

Differential diagnosis of ARIA
An important differential for ARIA‑E is ischemic stroke. Both can present with non‑specific symptoms such as confusion, headache, and visual or gait disturbances. ARIA‑E edema appears as bright parenchymal hyperintensities on T2‑FLAIR, which can mimic ischemic stroke, but DWI can help distinguish the two—acute ischemic stroke shows diffusion restriction, whereas ARIA‑E does not.
Other causes of T2‑FLAIR hyperintensities to consider include subarachnoid hemorrhage, uncontrolled hypertension, low‑grade glioma, and posterior reversible encephalopathy syndrome (PRES). PRES can arise from drug toxicity (such as from antineoplastics, immunosuppressants, and glucocorticoids), severe hypertension, or sepsis, and often presents with symptoms similar to ARIA (see Clinical presentation and management).
The differential diagnosis for ARIA‑H includes trauma, stroke, clotting disorders, and cavernoma.
ARIA classification and grading
The severity of ARIA can impact clinical management; thus, classification should follow a standardized framework. While detailed lobar rating scales exist, a coarser general rating scale may suffice for clinical use.
ARIA-E rating is based on the largest in-plane diameter of the largest T2-FLAIR finding, with cut-offs < 5 cm, 5-10 cm and > 10 cm to define mild, moderate and severe stages. Studies have shown that whether you use the basic 3‑level scale (mild, moderate, severe) or the more detailed 5‑level scale (mild, mild +, moderate, moderate +, severe), the ratings agree closely with those from a fully region‑by‑region scoring system.
ARIA-H rating is based on the classification of the number of new microhemorrhages. The categories may vary depending on drug and region, but typically are 0-4, 5-9 and 10 or more new microhemorrhages (excluding pre-existing ones). Superficial siderosis areas are usually counted individually and not grouped, given their greater clinical relevance.
| MILD | MODERATE | SEVERE | |
|---|---|---|---|
| ARIA-E (sulcal or [sub]cortical) | 1 location <5 cm | 5 – 10 cm OR ≥ 1 location | > 10 cm |
| ARIA-H (new micro-hemorrhage) | ≤ 4 | 5 – 9 | ≥ 10 |
| ARIA-H (new superficial siderosis) | 1 focal area | 2 focal areas | ≥ 3 focal areas |
Note: This classification was implemented with axial T2-FLAIR and T2* GRE during clinical trials. Future clinical practice could implement a reassessed score that uses more sensitive protocols (e.g. including 3D T2-FLAIR and/or SWI).
Clinical management
Detection of ARIA requires frequent MRI monitoring. Depending on the specific drug, presence of symptoms, severity of ARIA, and risk factors (such as APOE ε4 genotype), the medication may be continued, interrupted, or suspended. Guidelines suggest continuing treatment if ARIA-E and ARIA-H are mild and asymptomatic (see Recommended literature). All clinical decision-making should be context dependent.
Caution is warranted in patients with pre-existing cerebrovascular disease. Baseline markers of CAA or prior ischemic stroke/brain injury may warrant exclusion from treatment, depending on their severity and extent. (see Recommended literature). These markers can be useful for personalized clinical decision-making.
Importantly, current appropriate use recommendations caution against the use of antithrombotic agents in patients under anti-amyloid therapy until additional safety evidence is available.
Improving radiology workflow
The introduction of anti-amyloid therapies in clinical practice will increase the number of MRI scans performed in patients with dementia. Scans will be needed first at baseline to assess patients for treatment eligibility and to exclude other disorders, and secondly for monitoring the potential occurrence of ARIA in those who commence therapy. Therefore, radiology departments will need solutions to manage the increased workload.
Potential solutions include:
- Additional training for radiologists in ARIA identification
- Only a few clinical centers and a limited number of clinicians were involved in anti-amyloid therapy clinical trials, and most (neuro)radiologists are not yet experienced in identifying ARIA
- Clinicians should undertake training in the detection and management of ARIA
- Reducing acquisition time
- Faster image acquisition, such as by using ultra-fast MRI protocols, could be implemented at baseline and for ARIA monitoring
- Reducing scan time will enable radiology departments to image more patients within a given time slot
- Image registration and subtraction
- Comparison of scans to detect changes can be greatly facilitated by image registration in PACS, particularly when using 3D sequences
- Detection can be further improved through image subtraction
- AI tools for ARIA assessment and quantification
- Software tools have been developed to help clinicians identify the location of the different types of ARIA and quantify new microhemorrhages, superficial siderosis, and the volume and number of edema and sulcal effusions
- (Neuro)radiologists should validate and confirm AI-generated metrics and have the ability to incorporate them into radiology reports